Invest in loans,
diversify your portfolio
A unique alternative investment
opportunity in peer-to-peer lending
Are you an institutional investor?Contact us
A unique alternative investment
opportunity in peer-to-peer lending
Are you an institutional investor?Contact us
invested in people since 2005
Get started with one of our pre-set target investment mixes, or create your own custom mix. The interest earned is automatically reinvested in new loans, ensuring your money is working for you.
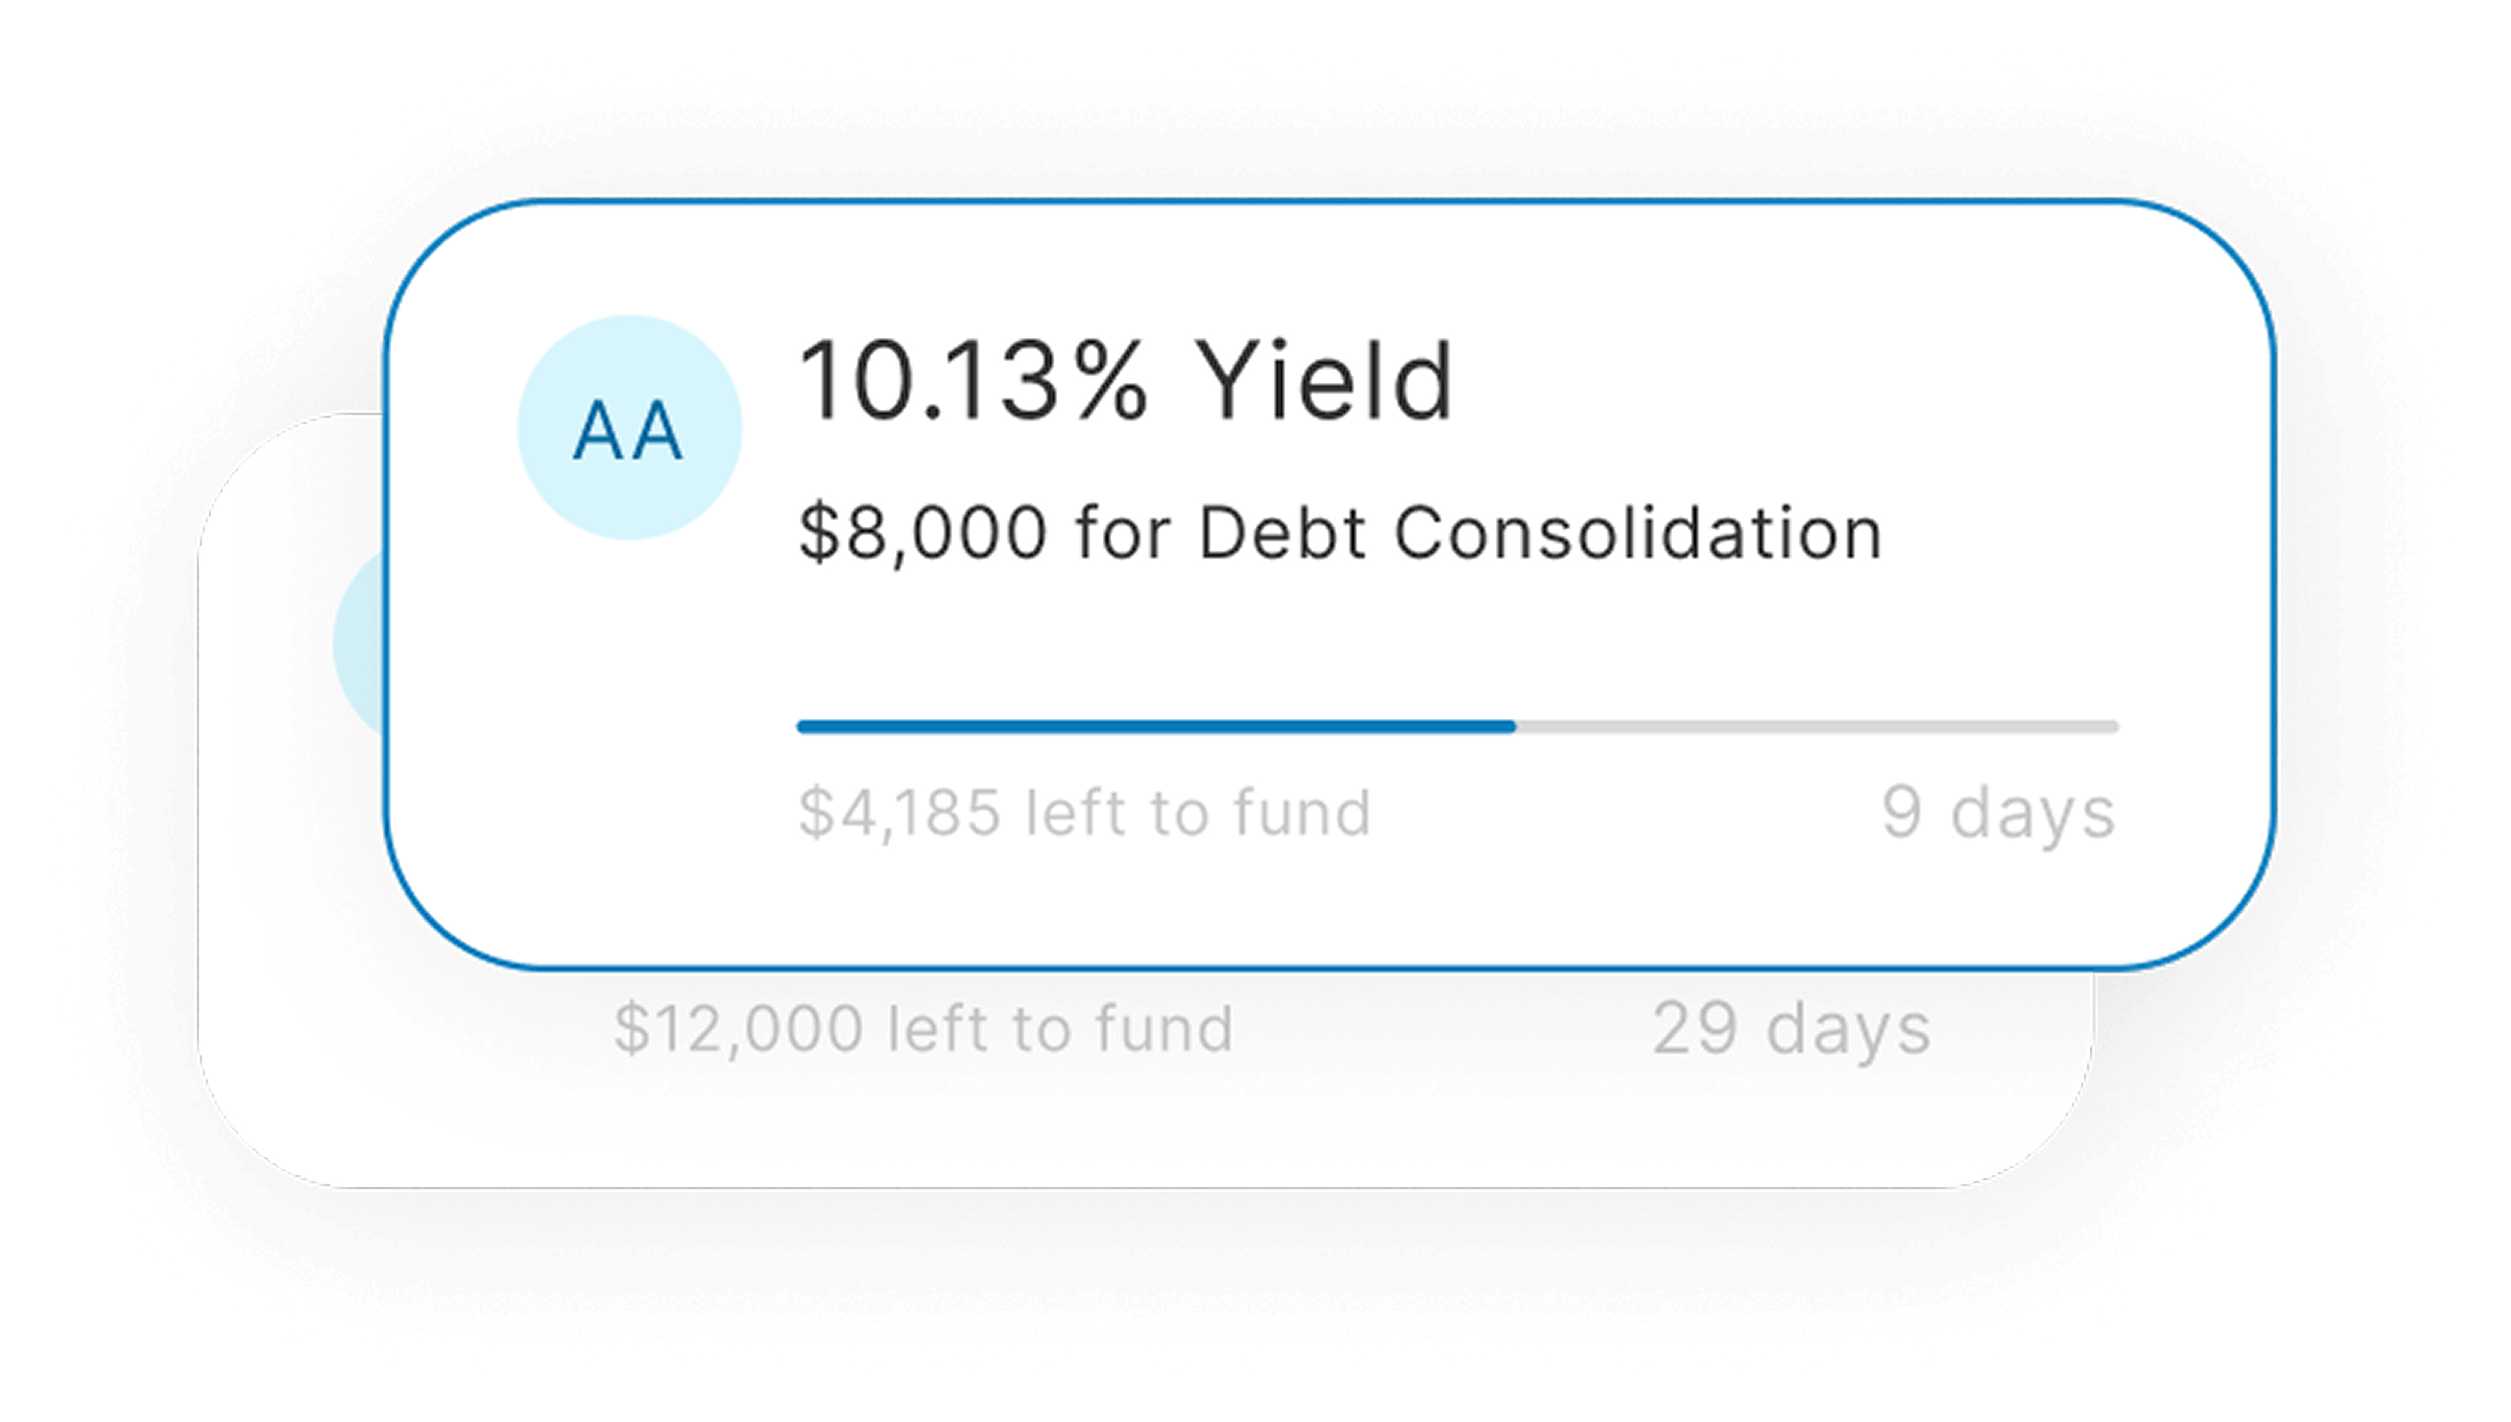
Select which personal loans you’d like to invest in. You’ll have the financial details to help you make savvy decisions. You can check out listings here.
The process is quick & easy, and you can start investing with as little as $25
You can invest in small portions
of a variety of loans
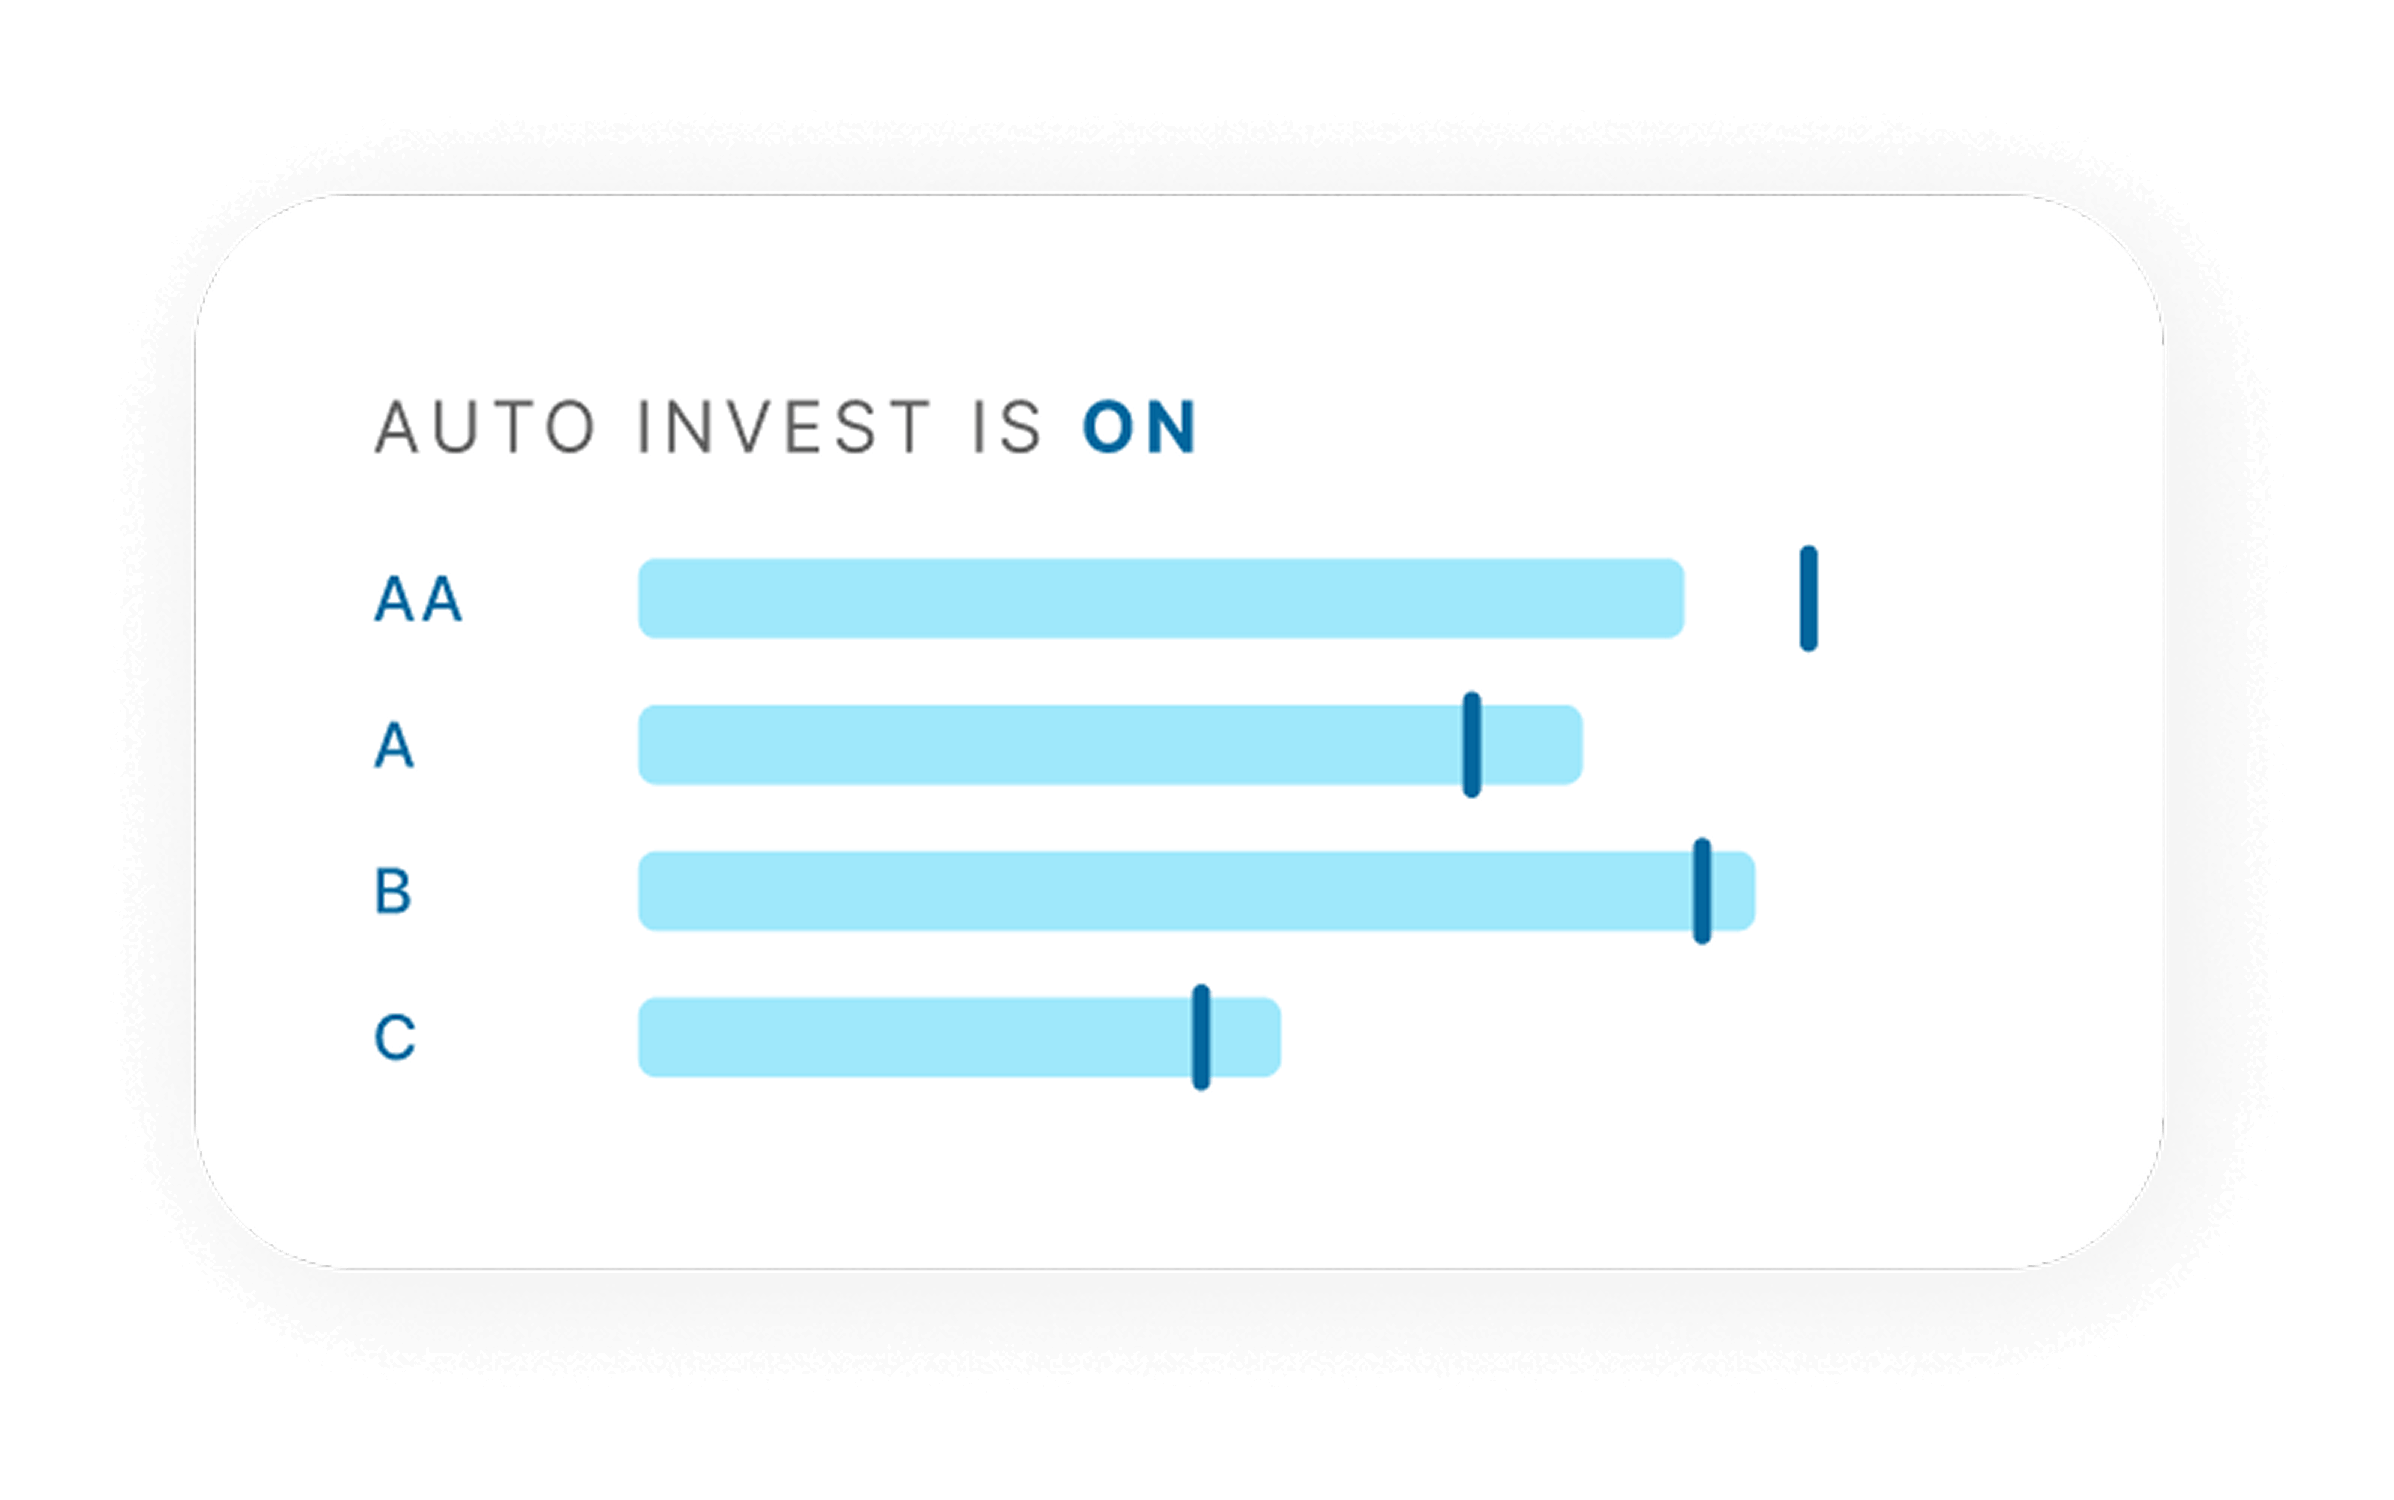
Interest can be automatically reinvested through Auto Invest or Recurring Invest
Prosper loans are assigned a rating from AA (lower risk, lower return) to HR (higher risk, higher return). Choose a mix with our Auto Invest tool to build your portfolio.
Prosper loans are assigned a rating from AA (lower risk, lower return) to HR (higher risk, higher return). Choose a mix with our Auto Invest tool to build your portfolio.


Visit the Prosper Help Center for more support
Prosper is an online peer-to-peer lending marketplace, where creditworthy borrowers can request a loan and investors can invest in “notes” (or portions) of each loan.
After a borrower accepts their loan offer, we may verify their application information. Upon borrower acceptance, investors have up to 14 days to commit funds to the loan through their Prosper account. Once a borrower passes any additional verification requirements and one or more investor(s) commit enough funds to the loan it’s ready for origination.
Loans through Prosper are amortized, meaning borrowers make fixed monthly payments throughout the duration of their 2, 3, 4 or 5 year term. Each payment is comprised of principal, interest, and any applicable fees. Investors receive a portion of those payments that are proportional to their pro rata share of the loan. These funds are deposited directly into investors’ Prosper Accounts.
With any debt, there’s always the risk that a borrower can default on their loan, which could result in a loss for the investor(s) who invested in the loan. Loans are unsecured obligations, meaning they are not secured by any collateral of the borrower. To assess the risk of each loan before committing funds, investors should review the loan request details and the Prospectus.
Retail investors must be United States permanent residents or citizens who are 18 years of age or older, with a valid Social Security number (or other Taxpayer Identification Number, if investing through a trust, estate, or corporate entity) and checking or savings account. Retail investors must reside in a state that is open to Prosper investors and may also be required to meet suitability requirements established by their state of residence. See more state requirements here.
While we can’t make any specific recommendations; we have found that investors generate a more stable return when they diversify their investment through many different Notes, with each Note corresponding to the borrower loan of a different borrower. Prosper’s Notes are offered by Prospectus which is an official document that describes all the key information for the investments we offer. You can find our Prospectus on our website at the bottom of any page at www.prosper.com.
For individual general investment accounts, the minimum amount you can invest is $25.
For IRAs managed by our designated custodians, Millennium Trust Company and Alto IRA, the minimum investment amount required to qualify for custodian fee reimbursement is $5,000 in year 1 and $10,000 in all subsequent years. Please note that these minimums refer to the amount invested in Prosper Notes — cash balances will not be counted.
The cash balance of your Prosper investment account is FDIC insured by Wells Fargo Bank, N.A., a depository bank.
The FBO account that we maintain at Wells Fargo Bank, N.A. for the benefit of investors is FDIC-insured on a “pass through” basis to individual investors, subject to applicable limits and conditions. This means that each individual investor’s balance is protected by FDIC insurance, up to the aggregate amounts established by the FDIC. Other funds the investor has on deposit with Wells Fargo may count against the FDIC insurance limits. Prosper is not an FDIC-insured depository institution. FDIC insurance only covers the failure of Wells Fargo, the FDIC-insured depository institution.
Please be aware that any funds lost due to borrower default or poor Note performance are not FDIC insured, and any invested funds are not deposits, are not guaranteed by any agency of the federal government or by Wells Fargo, and may lose value.
Personal Loans offered through Prosper are 2, 3, 4 and 5 year terms – meaning borrowers make fixed monthly payments throughout the duration of their loan’s term. Each payment is comprised of principal, interest, and any applicable fees. Investors receive a portion of those payments that are proportional to their pro rata share of the loan. These funds are deposited directly into investors’ Prosper Accounts as uninvested available cash.
Any uninvested available cash in your account is FDIC-insured and can be withdrawn whenever you wish, but your investment (principal and interest) is repaid to you over the course of the underlying loan term.
If the borrower does not satisfy their monthly payment within 15 days of the due date, the borrower will be charged a late fee. Late fees are 5% of the payment amount or $15, whichever is greater (unless state restrictions apply).
We divide and distribute the late fees proportionately among the investors in the corresponding Notes, subject to deductions for collection fees and servicing fees.
Collections
If a loan is more than one day past due, we may collect on it directly or we may refer it to a third-party servicer or collection agency. Once a loan reaches 121 days past due, it is charged off. Historically, recovery rates on loans once they have entered into collections range from 7-12%.
Investors cannot attempt their own collections efforts or attempt to contact borrowers directly.
IMPORTANT INFORMATION ABOUT PROCEDURES FOR OPENING A NEW ACCOUNT.
To help the government fight the funding of terrorism and money laundering activities, Federal law requires all financial institutions to obtain, verify, and record information that identifies each person who opens an account.
What this means for you: When you open an account, we will ask for your name, address, date of birth, and other information that will allow us to identify you. We may also ask to see your driver’s license or other identifying documents.
1. Weighted average historical return for loans originated through Prosper as of March 31 2025. To be included in the historical return (“Historical Return”) calculation, the loan must have originated (a) on or after July 1, 2009, and (b) at least 12 months prior to the calculation date. Historical Returns are based on actual payments (other than principal) received by the investor net of fees and losses (including from charged-off loans). We calculate the Historical Return for loans originated through Prosper as follows. First, loans are separated into distinct “Groups” based on the specific month and year in which they were originated and their Prosper Rating at origination. For each Group, we calculate: (a) the sum of the interest paid, plus late fees, minus servicing fees, minus collection fees, in each case on active loans, plus net recoveries on charged-off or defaulted loans, plus net debt sale proceeds on sold loans, minus gross principal losses; divided by (b) the sum of the principal balances outstanding on active loans at the end of each day since origination. We then annualize the result to get the “Historical Return” for the Group. Once this calculation is performed for every Group, we compute the cumulative outstanding principal dollar weighted average of their Historical Returns. This gives us the “weighted average Historical Return” for loans originated through Prosper. For purposes of this calculation, “active” means loans that are either (i) current in payments or (ii) delinquent, provided that delinquent loans that have charged-off or are in default are not considered active. Loans that have paid off are also not considered active.
The Historical Return calculation (a) is updated quarterly; and (b) excludes the impact of servicing related corrective non-cash adjustments that may modify the outstanding balance or status of a borrower loan. The actual return on any Note depends on the prepayment and delinquency pattern of the loan underlying each Note, which is highly uncertain. Individual results may vary. Historical performance is no guarantee of future results and the information presented is not intended to be investment advice or a guarantee about the performance of any Note.
2. To establish each pre-set Auto Invest mix, Prosper Notes are distributed across all risk ratings from AA to HR according to Historical Inventory of each risk rating, then: (x) weighted towards AA, A and B risk ratings, for the AA-B Weighted mix; (y) weighted towards D, E, and HR risk ratings, for the D-HR Weighted mix; and (z) unweighted, for the Marketplace Mix. Historical Return range represents the dollar weighted 10th-90th percentile of the Weighted Historical Returns for the mix of loan ratings. Historical Returns are based on actual payments (other than principal) received by the investor net of fees and charge-offs on loans originated through the Prosper platform. To be included in the Historical Return calculation, the loan must have originated (i) on or after July 1, 2009, and (ii) at least 12 months prior to the calculation date. We calculate Historical Returns for loans with this rating or mix of ratings (as applicable) as follows. First, for each origination month, or “Vintage”, we calculate (for all eligible loans): (a) the sum of the interest paid, plus net recoveries, plus net debt sale proceeds, plus late fees, minus servicing fees, minus collection fees, minus gross losses from charge-offs; divided by (b) the sum of the average principal balances outstanding at the end of each day of the calculation month. We then annualize the result to get the “Historical Return” for the Vintage and rating. This calculation is performed for every Vintage, and each applicable rating. Finally, we compute the origination dollar weighted Historical Return of each Vintage and relevant rating to get their “Weighted Historical Returns”.
The actual return on any Note depends on the prepayment and delinquency pattern of the loan underlying each Note, which is highly uncertain. Individual results may vary. This information is not intended to be investment advice. Historical performance is no guarantee of future results or a guarantee about the performance of any Note. Based on data from current Historical Inventory. Historical Return information as of Jun 30 2025.
Historical Inventory refers to the proportion of Notes on the marketplace represented by each Note risk rating. It is based on the most recent month (approximately) of inventory of the marketplace; provided, however, that Prosper reserves the right to apply such further adjustments to the Historical Inventory and/or the related pre-set target mix as it deems necessary to more accurately reflect the projected availability of each Note risk rating on the platform for the coming month.
Prosper’s borrower payment dependent notes (“Notes”) are offered pursuant to a Prospectus filed with the SEC. Notes are not guaranteed or FDIC insured, and investors may lose some or all of the principal invested. Investors should carefully consider the risks, uncertainties, and other information described in the Prospectus before investing. Investors should consult their financial advisor if they have any questions or need additional information. Nothing on this page is intended to be investment advice.